Using Scenario Planning Tools to Regain Control During Supply Chain Disruptions


 18 Jun 2025
Economic volatility is a given right now — and has been for quite some time. There’s no predicting how trade disputes and waning consumer confidence could lower demand, impact prices, or increase operational risk.
While FP&A teams can’t know how the international trade disputes dominating the headlines will land, scenario modeling can help them proactively adapt to changes like tariffs and other supply chain disruptions.
In this article, we’ll show you how to model five tariff-related scenarios with support from a financial performance management solution.
Why flexible, real-time modeling is essential during disruption
When disruption happens, a static plan won’t cut it because the assumptions it’s built on can break overnight. Shifts like a sudden spike in supplier costs, a delayed shipment, or an unexpected tariff can turn yesterday’s best-case scenario into today’s financial risk.
With a modern solution like Planful, FP&A teams can move quickly, remain agile, and keep leadership aligned no matter how conditions change. Here’s how:
- Rapid scenario creation allows you to adjust faster if assumptions break. Build and adjust multiple financial scenarios quickly without having to start from scratch. Make real-time changes to key drivers and instantly see how they affect the entire forecast, so Finance can offer fast, forward-looking guidance.
- Easily make top-down adjustments without manual rework. Use topside adjustments and breakback allocation to apply changes like revenue targets or cost assumptions across your models without manually recalculating every detail.
- Tell the full story with side-by-side scenario comparisons. Keep original plans intact while layering in alternative outcomes. Quickly show leadership the best, worst, and base case views.
5 scenario planning examples to help you prepare for supply chain disruptions
FP&A teams can’t easily model the impact of pricing and sourcing decisions with traditional planning tools. Spreadsheets aren’t built to handle layered, fast-changing scenarios dependent on dynamic business factors.
With scenario planning software from modern FP&A platforms like Planful, finance pros can quickly explore the impact of different business decisions and economic outcomes.
Let’s look at five examples of scenario planning to illustrate how FP&A teams can model and evaluate their response strategies to uncertain economic conditions.
1. Sudden spike in supplier costs
Consider a key international supplier that raises prices by 20%. How would this increase impact cost of goods sold (COGS)?
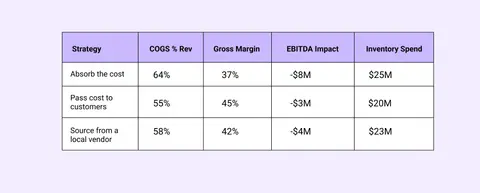
Finance needs to evaluate how to manage the cost without damaging profitability or operations. This scenario explores three options: absorbing the cost, passing it to customers, or sourcing from a local vendor, each with distinct implications for COGS, margin, EBITDA, and inventory spend.
- Absorbing the cost drives COGS to 64% of revenue, compresses gross margin to 37%, and leads to an $8M EBITDA loss—the steepest financial impact of the three options. It also requires the highest inventory spend at $25M.
- Passing the cost to customers helps preserve margins, improving gross margin to 45% and reducing COGS to 55%, with an EBITDA loss of $3M. It also carries the lowest inventory spend at $20M.
- Sourcing from a local vendor results in COGS of 58%, gross margin of 42%, and a $4M EBITDA loss. While slightly less profitable than passing the cost on, it may offer supply chain stability and avoid the sharp drop seen when absorbing costs. Inventory spend lands in the middle at $23M.
This type of scenario planning, using a tool like Planful, not only manages risk but also allows Finance to become a critical partner to business leadership, offering real-time, data-driven insights that guide high-stakes decisions throughout the organization.

2. Cost increases trigger pricing discussion
Building on the previous example, let’s say finance wants to explore the financial impact of passing supplier costs onto customers more thoroughly. They assess pricing sensitivity assumptions to identify a potential sweet spot.
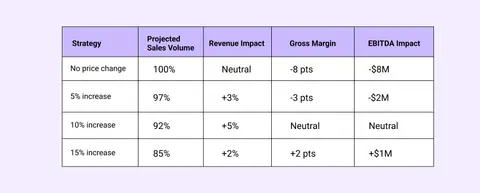
- With no price change, sales volume holds at 100%, but gross margin drops by 8 points and EBITDA falls by $8M.
- A 5% increase causes only a slight dip in volume (to 97%) and lifts revenue by 3%, but still results in a $2M EBITDA loss and a 3-point margin decline.
- At a 10% increase, sales volume dips further to 92%, but revenue improves by 5%, gross margin returns to neutral, and EBITDA impact levels off, making this a breakeven scenario.
- Pushing to 15% reduces volume to 85%, but still delivers a 2% revenue lift, a 2-point gross margin gain, and a $1M boost to EBITDA, though with a greater risk of customer satisfaction and future impact on lifetime value.
This analysis enables the team to weigh trade-offs between pricing, customer retention, and profitability, and highlights how a 10% increase may offer the optimal balance between volume and financial recovery.
The table below illustrates how pricing sensitivity may impact sales volume, revenue, and profit.
3. Sales forecast signals a need for smarter resource planning
Let’s switch gears. Imagine your sales leaders forecast a 10% decline due to softening in your largest market.
Your CFO wants to know: How can we stay resilient next quarter while driving operational efficiency?
With Planful’s Dynamic Planning and Planful for Workforce Pro solutions, your finance and HR teams can model different scenarios to evaluate the operational and workforce impact in real time before making decisions:
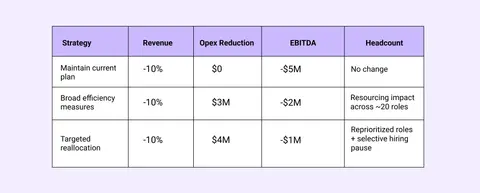
- Maintain current plans: Continuing with existing budgets and staffing preserves momentum but could result in a projected $5M EBITDA loss, with no OPEX reduction.
- Apply broad efficiency measures: A 5% across-the-board reduction lowers OPEX by $3M and reduces the projected loss to $2M, but may affect in-flight projects and team productivity without clear strategic prioritization.
- Take a targeted, strategic approach: Scenario modeling shows that delaying lower-priority initiatives, pausing non-essential hiring, and reallocating resources toward high-impact areas can improve efficiency, delivering $4M in OPEX savings and narrowing the EBITDA loss to $1M, while minimizing disruption.
This scenario highlights the value of a connected workforce and operational planning: instead of relying on blunt measures, teams can align around data, explore the ripple effects of each decision, and respond with confidence.
4. Supply chain disruptions prompt overstock decision
In this example, an organization is considering a bulk inventory purchase in Q1 to hedge against a possible upcoming cost hike. Would increasing Q1 inventory spend by 30% act as a smart hedge or an unnecessary risk?
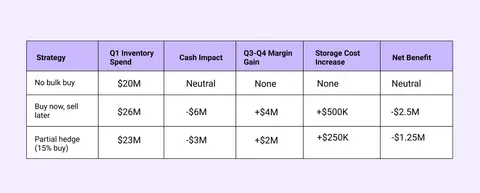
The chart below provides clarity on the different options: a full hedge drains $6M in cash but delivers only a modest margin gain, while a partial hedge cuts risk in half and still protects future profitability.
- No bulk buy keeps Q1 inventory spend at $20M with no cash impact, margin gain, or added storage cost. It’s the lowest-risk option but offers no future benefit.
- A full hedge (“buy now, sell later”) increases Q1 inventory spend to $26M and triggers a $6M cash drain. It generates a $4M margin gain in Q3–Q4, but also adds $500K in storage costs, leading to a net loss of $2.5M.
- A partial hedge (15% buy) lands in the middle, raising Q1 spend to $23M, reducing cash by $3M, and delivering a $2M margin gain later in the year. With $250K in added storage cost, the net loss comes to $1.25M.
Scenario planning tools, such as Planful, allow Finance teams to clearly evaluate these tradeoffs and layer in projected cash impacts and warehousing costs.
5. Cost relief hits the market
Let’s look at scenario planning from one final angle. After months of volatility, the cost of a key commodity drops 15%.
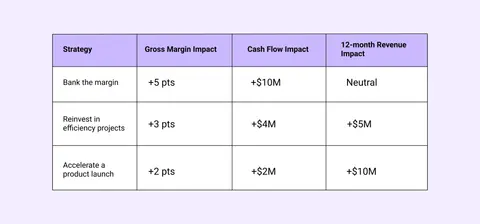
Should the organization bank the margin to strengthen the balance sheet, use the windfall to invest in a much-needed transformation project, or fast-track a product launch to capture market share?
- Banking the margin delivers the strongest cash flow impact at +$10M and improves gross margin by 5 points, but has no short-term impact on revenue. It’s the most conservative option and ideal for balance sheet strength.
- Reinvesting in efficiency projects results in a 3-point margin improvement, generates $4M in cash, and is expected to drive a $5M revenue lift over 12 months. This path strikes a balance between short-term returns and long-term gains.
- Accelerating a product launch offers the greatest upside to revenue (+$10M over 12 months), but with more modest margin (+2 pts) and cash flow (+$2M) improvements. It’s a growth-oriented strategy with higher risk.
This type of scenario planning enables finance teams to strike a balance between stability and growth, optimizing the strategic use of a short-term tailwind.

How Planful’s scenario planning solution supports financial accounting for tariffs and other disruptions
Running what-if scenarios keeps FP&A teams in control during volatile markets. With Planful’s scenario modeling solution, you can explore, adjust, and act faster to protect your business with data-backed decisions for whatever happens next.
Before you go, remember these 3 things…
- Scenario planning tools reduce uncertainty by helping Finance instantly model supply chain disruption and guide faster, data-driven decisions.
- Real-time modeling protects margins by showing how pricing, sourcing, and workforce changes impact forecasts in seconds.
- Planful accelerates response strategies with rapid scenario creation, side-by-side comparisons, and dynamic, driver-based models.
Planful helps teams like yours plan for what’s next.
Explore our interactive demo to see how quick and easy scenario planning can be.
FAQs
What are scenario planning tools and why are they useful during supply chain disruptions?
Scenario planning tools help teams model different financial outcomes based on shifting costs, demand changes, and/or supplier instability. They make it easier to test assumptions, compare best-case and worst-case outcomes, and anticipate operational impacts before they hit. During supply chain disruptions, these tools provide a faster, more reliable way to forecast risk than spreadsheets.
How can finance teams model the impact of supplier cost changes?
Finance teams typically adjust key drivers—like COGS, pricing, and volume—in scenario planning tools to see how margins and EBITDA shift under different assumptions. This makes it easier to evaluate options such as absorbing costs, adjusting prices, or sourcing from new vendors. The goal is to understand tradeoffs quickly so leaders can make informed decisions.
What makes Planful effective for real-time scenario planning?
Planful offers rapid scenario creation, topside adjustments, and instant, driver-based updates across the entire model—features that traditional tools can’t match. This lets FP&A teams react to supply chain disruptions faster while keeping leadership aligned on accurate, real-time forecasts. It’s a practical way to build resilience without adding manual work.
Latest Posts
Blogs
Interviews, tips, guides, industry best practices, and news.
Get Started with Planful
- How much time will you save?
![LinkedIn]()
- How will your finance team evolve?
![LinkedIn]()
- Where will technology support you?
![LinkedIn]()
