Meet Planful’s Analyst Assistant — your trusted AI-powered partner for finance, always ready for you.
Learn more

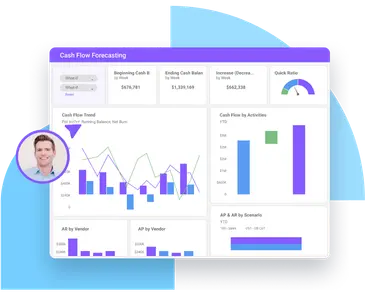
Dashboards With Planful
Trusted by 1,000+ companies
Spend Time Understanding Your Business, Not Formatting Reports
Dashboards with Planful helps business leaders keep an eye on key metrics to better drive their actions. Easily spot trends, identify performance gaps, and stay ahead of challenges with powerful visualizations that bring together financial and operational data.

You’re in Good Company
“Before, there was a lag between getting data and getting the analysis. With Planful, they could do that digging on their own.”


How Planful Helps You


Get the Latest Data With Auto-Update
Leverage Planful’s dimensional hierarchies and substitution variables so your dashboards automatically update as you roll into new planning cycles and expand your business structures. No administrative maintenance or manual updates required.


Drill Up or Down to Any Level
Use interactive dashboards to drill down into charts for more details and a deeper understanding of your data. Then pull back to spot trends without creating several versions of the same chart.

Drag and Drop to Your Heart’s Desire
Drag-and-drop functionality, plus an intuitive interface and user experience, let you build and customize dashboards without any coding knowledge or intensive training.
Learn how to turn your plan into overdrive
See Planful in ActionStreamline Accounting and Finance from Start to Finish
Accelerate access to actuals, create insightful reports and analyses, and manage financial and operational planning all within Planful.
Get Started with Planful
- How much time will you save?
![LinkedIn]()
- How will your finance team evolve?
![LinkedIn]()
- Where will technology support you?
![LinkedIn]()
