What Belongs in a Marketing Dashboard?


Dashboards are a powerful tool for marketers and marketing teams to leverage. As a digital marketer, you’re familiar with how powerful tools like Google Analytics, Google Ad words, SEMrush, and other dashboards are. Marketers rely on the data from the dashboards to track your marketing efforts.
Whether it’s daily, weekly, monthly or quarterly, marketing dashboards are used by digital marketers, marketing agencies, and CMOs to track data, KPIs and information needed all in one place. You can have specific dashboards for separate online marketing channels, including email, content marketing, social media, SEO, and online advertising.
Most importantly, marketing dashboards can provide the data needed to see the bigger picture – tracking your marketing ROI (return on investment) and true business value of your marketing efforts. From a broad sense, you want to make sure that the campaigns you build and what you spend budget on is actually bringing in the return on investment needed to hit your goals.
In this blog, we review what a marketing dashboard is, the components and functionalities in a dashboard that help make marketers more successful, and how dashboards can help you track your budget, measure marketing ROI, and track the goals of your marketing efforts.
What is a marketing dashboard used for?
Marketing dashboards are a valuable reporting tool that allows marketers to analyze data, visually display digital marketing analytics, and track KPIs (key performance indicators). With these dashboards, marketers, and teams can get a pulse of how their marketing plans and campaigns are performing. Dashboards are updated in real-time and visibility to display data for all members to get access to.
Functionalities of Marketing Dashboards
Marketers have been known to leverage a number of tools and platforms to track the performance of a marketing campaign or channel. What are the components of a good marketing dashboard? The best dashboards display data that can be taken and used for action. In other words, taking the data, and applying it to make a change or update to a campaign.
- Metrics – You can measure KPIs to track on an ongoing basis (daily, weekly, monthly, quarterly, or yearly). It should also provide the opportunity to measure against several KPIs.
- Easy to read and understand – a great dashboard should be easy for both marketers and non-marketers to understand and interpret.
- Provides up-to-date data – a marketing dashboard will provide data in real-time. At any time, marketers should be able to access data that is completely up-to-date.
- Visualization – the dashboard should be visual components to illustrate marketing data. The ability to create bar graphs, pie charts, or line graphs that measure performance over time can help visualize data, and help to tell a story when included in a marketing report.
- Filterable – With marketing dashboards, you have the ability to drill down your data and analytics. This allows marketers to analyze data and track the performance of specific campaigns and marketing channels. Data within a marketing dashboard can typically be filtered by:
- Timeframe or a specific date – oftentimes this is by year, month, week, and even down to the day.
- Marketing channel
- Specific marketing campaigns
- Scalable – the ability to work with large data sets and present performance metrics at a high level.
- Exportable – the data and graphs within a marketing dashboard can be exported to a presentation or report.
Using a Marketing Dashboard to Measure ROI
There are so many dashboards used in marketing today. Some measure website traffic and others track specific KPIs within a certain channel, like SEO, email, or event marketing.
What’s missing in this equation? A dashboard to measure the true business value of your marketing. We need to know if what we are spending our money on is actually bringing a return on investment. With many of these tools, there is no way to measure performance against all marketing expenses. Having a marketing dashboard that brings all of your marketing efforts together to measure MROI performance will help you get the full picture, and will likely allow you to approach using other specific marketing dashboards a little differently.
Marketing Dashboard Examples
How can you measure marketing performance, while getting the data needed to evaluate individual marketing channels and efforts? Here are some examples of online marketing dashboards that measure ROI. Each of these marketing dashboard examples covers key metrics to track on a weekly, monthly, quarterly, or yearly basis.
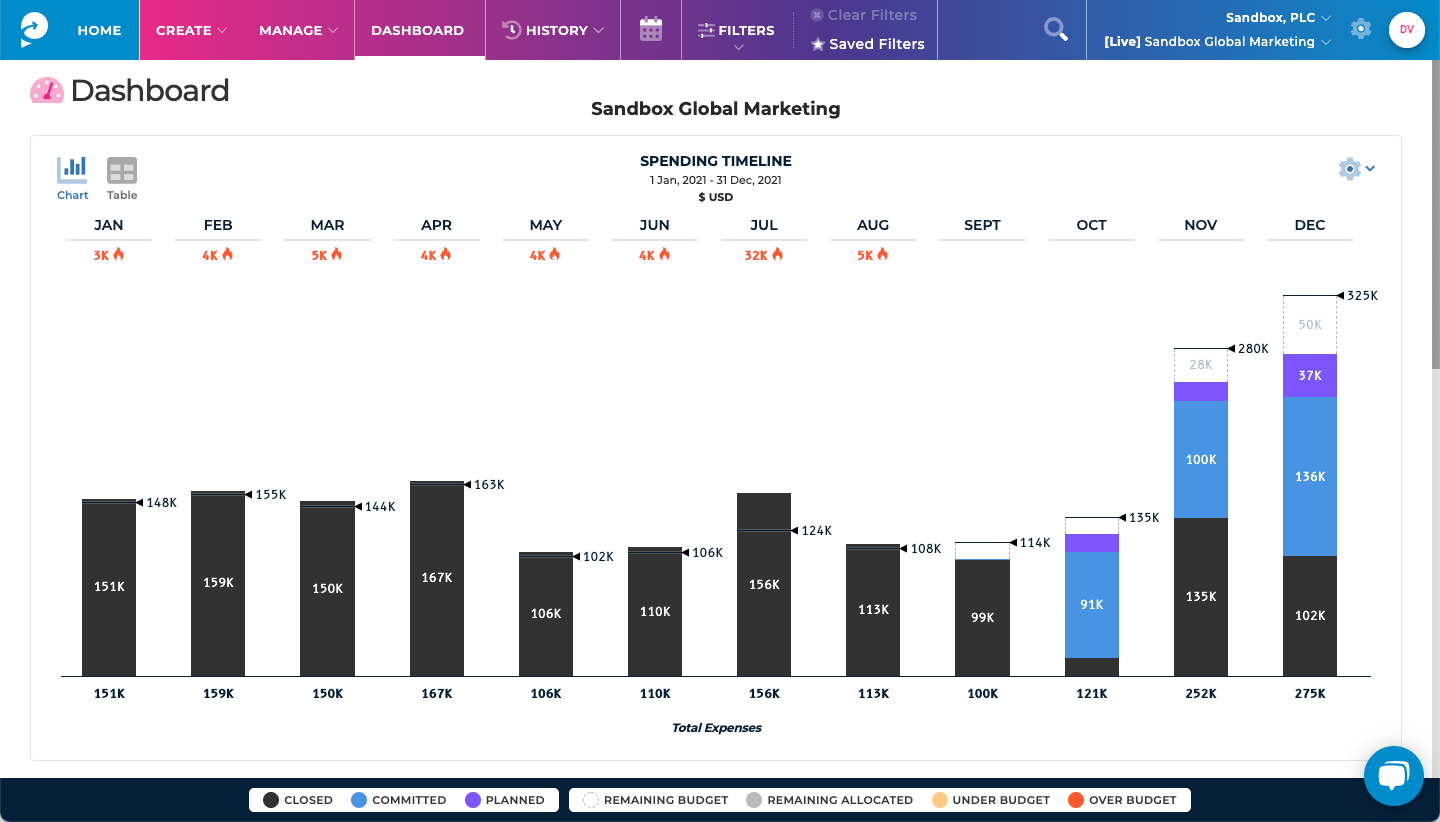
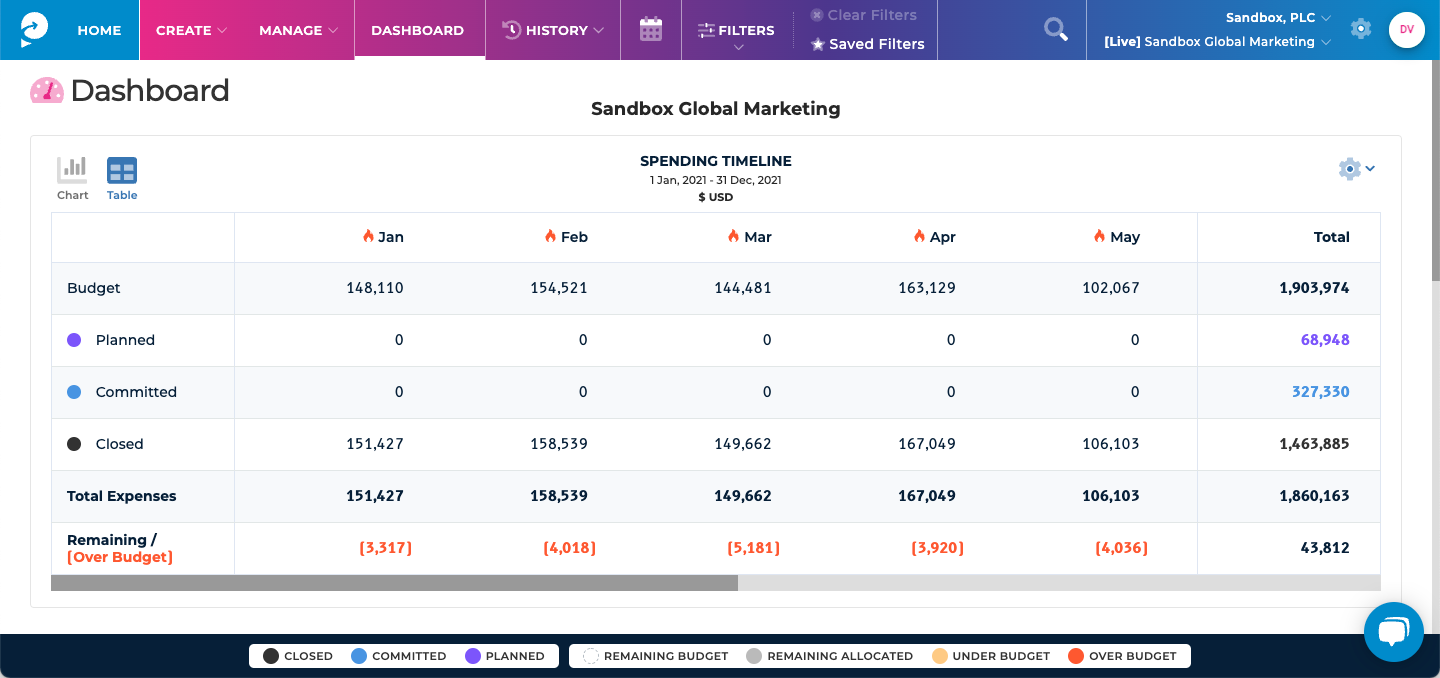
Budget timeline dashboard
The budget timeline dashboard measures what you’re expected to spend each month. It shows how the budget is being used up, and how committed your budget is over time (both past and future). It tracks planned expenses, what is available and what has been spent. It also measures if you are over budget for any particular month.
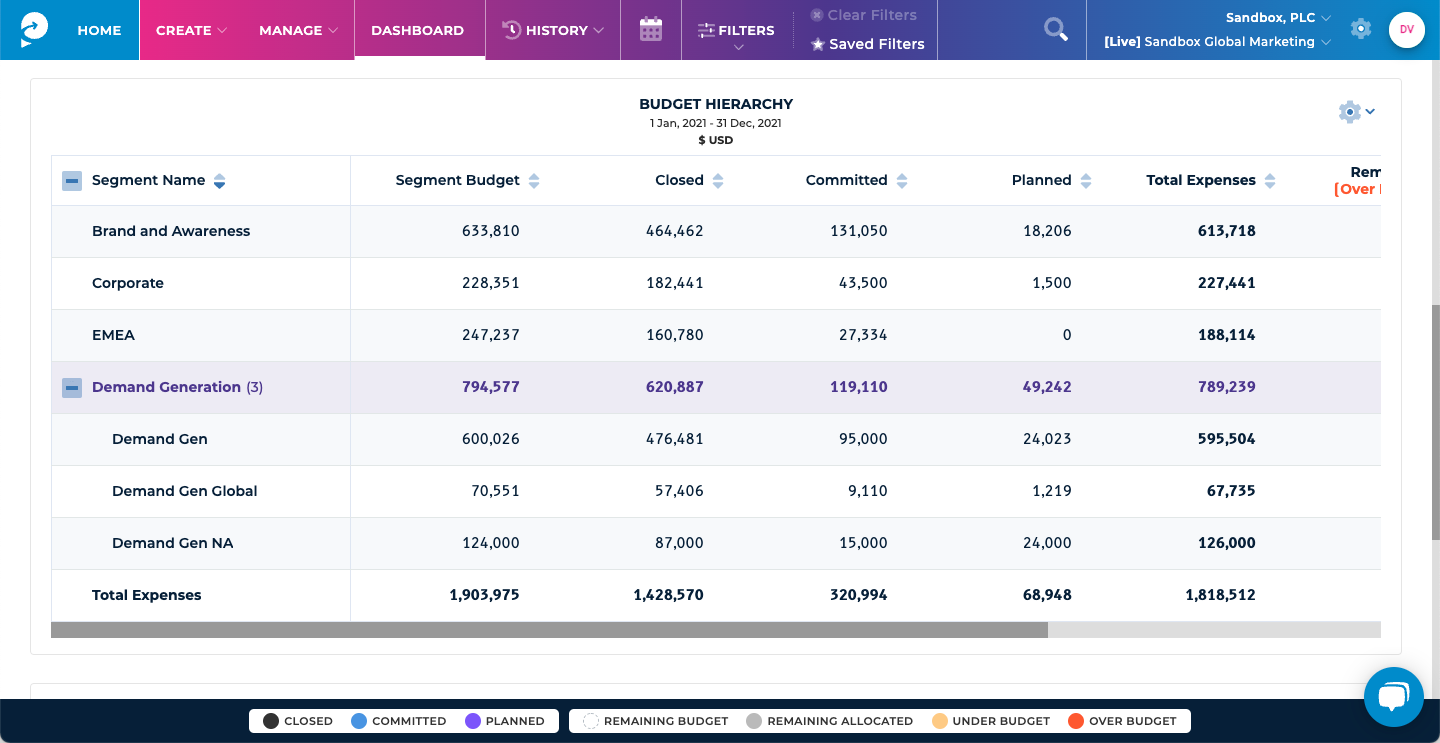
Budget hierarchy dashboard
The budget hierarchy dashboard measures how your marketing budget is allocated across different departments or teams in your marketing organization. It can also be done by product. This measures planned vs committed expenses by department or team.
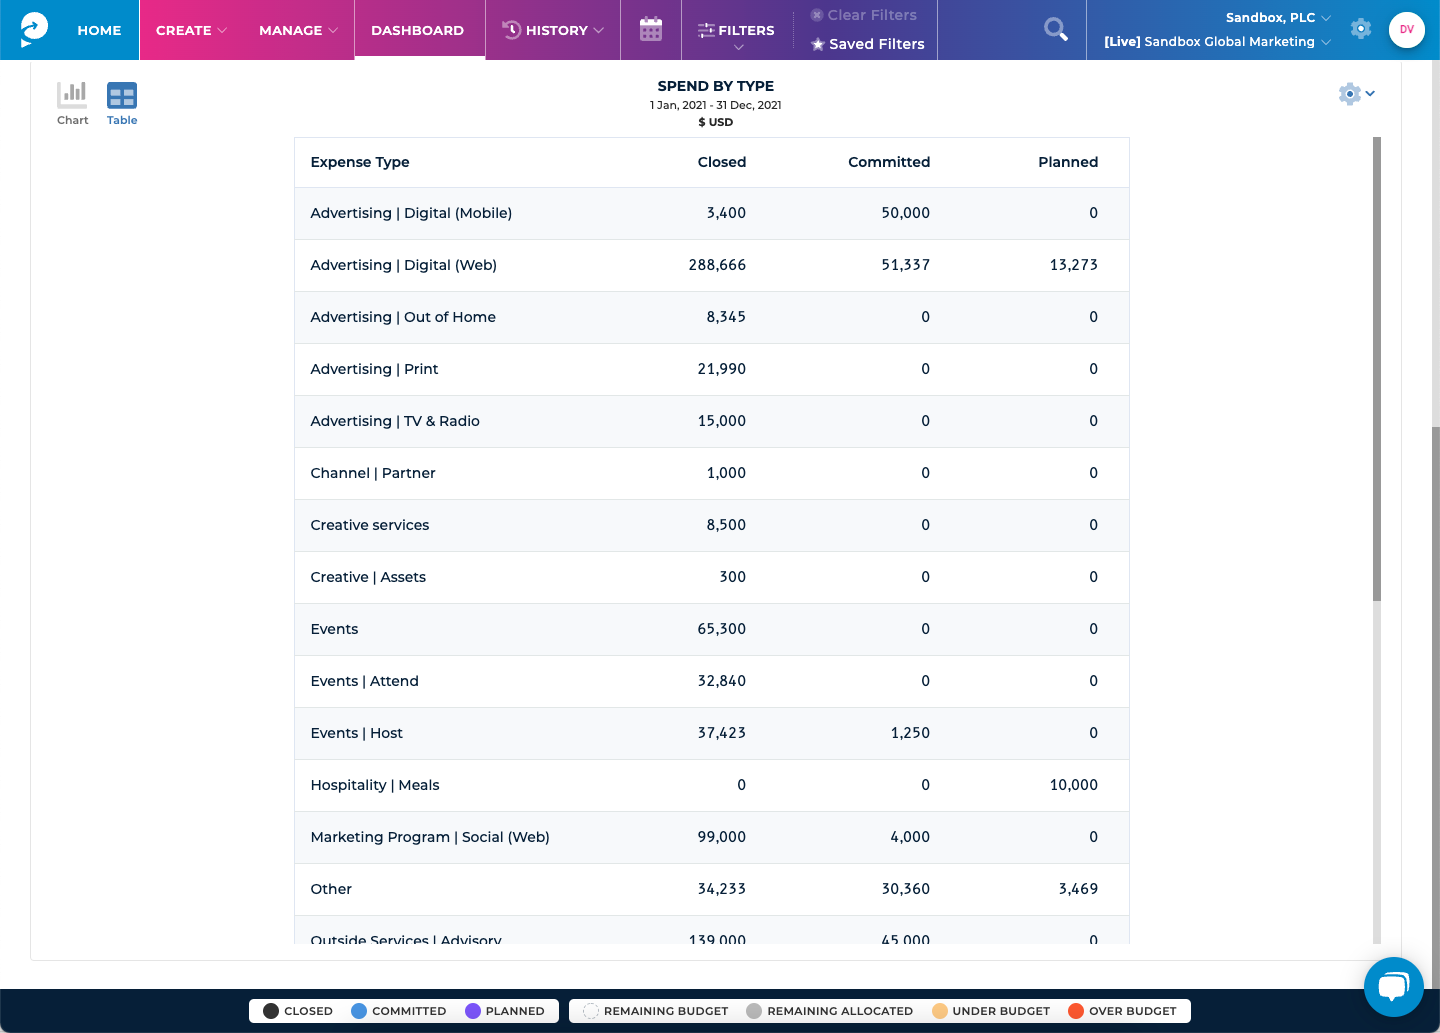
Spend by type dashboard
What are we spending our money on? What are your marketing bills for (what are you investing in)? The spend by type dashboard is a high-level breakdown of ROI by marketing channel. This includes channels like advertising (online and offline), social media and SEO, events and sponsorships as well as other types like technology, creative services, and outside services.
Spend by goal dashboard
Finally, are we spending toward our most critical goals? The spend by goal dashboard is where you can measure specific goals for marketing plans and campaigns (for instance, awareness, sales growth, thought leadership). You can see budget allocation toward your top goals in a campaign or plan, and it also measures money that is allocated toward no goal tracked.
How to Use Marketing Dashboards for Reporting
A great marketing dashboard will not only help you track performance, but helps you report on progress. Marketers can present data in the form of charts and visual data to present the performance against goals. Track your KPIs with marketing dashboards. This can be used to report to CMOs, CEOs, and executives (learn more about how to present marketing reports to CEOs).
Marketing Dashboard & ROI
Bring all of your marketing efforts together to see how they are performing? Are you getting an ROI? Planful helps you measure your marketing budget against performance. You no longer need to use Excel as a marketing dashboard. With Planful, you get a marketing performance dashboard that measures performance against ROI.


Latest Posts
Blogs
Interviews, tips, guides, industry best practices, and news.
Get Started with Planful
- How much time will you save?
![LinkedIn]()
- How will your finance team evolve?
![LinkedIn]()
- Where will technology support you?
![LinkedIn]()
