The New Marketing ROI: Part 4


The final part of our blog series on ROI covers a worked example of our approach to measuring the real ROI of a marketing campaign, and concludes by emphasizing the importance of adopting a consistent approach to tracking marketing ROI over time to enable benchmarking.
Worked Example of Marketing ROI calculation
In this example, we’re going to model a marketing ROI based on an integrated campaign to secure 50 new customers for a SaaS product. The average 1-year contract value is $10,000, and the typical customer retention rate is 6 years, yielding an LTV of $60,000. The business has an 80% gross margin.
After factoring in retention and renewal costs after the initial sale, the marketing team calculates that each lead is worth 50% of the LTV of the customer. The targeted return is therefore:
Return = 50 deals * 60,000 LTV * 80% GM * 50% value attribution
Return = $1,200,000
The team has a target ROI of 4, meaning their marketing investments should return 4 times the investment. The Marketing ROI calculation is as follows:
ROI = ($1,200,000 – Investment)/Investment
4 = ($1,200,000 – Investment)/Investment
We can impute the investment that would achieve this ROI at this target outcome as follows:
ROI = ($1,200,000 – Investment)/Investment
4 = ($1,200,000 – Investment)/Investment
4 * Investment = $1,200,000 – Investment
4 * Investment + Investment = $1,200,000
5 * Investment = $1,200,000
Investment = $1,200,000/5
Investment = $240,000
In principle, if you spend $240,000 and are successful in achieving your financial target, you will have achieved an ROI of 4. Now you must enter your funnel conversion metrics for each phase of your funnel and determine what top-of-funnel and mid-funnel programs need to be run.
Here are the results for our worked example (your numbers may vary):
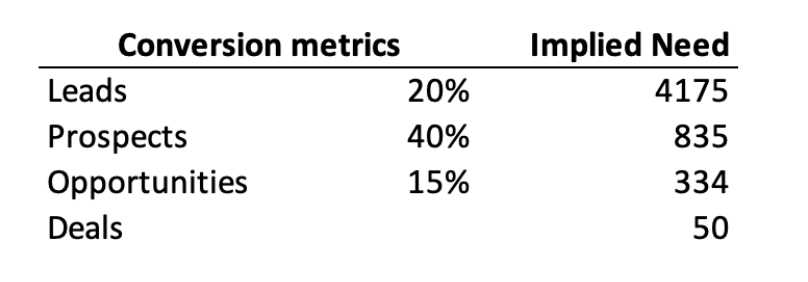
If we need 50 deals, then based on conversion metrics we can estimate that we need 334 opportunities, 835 prospects and so on, up the funnel. If we change our assumptions about conversion rates or target outcomes, then the implied needs further up the funnel will change accordingly. If you don’t know the specific conversion metrics for your organization, it is better to do some research and make an educated guess than to not use them at all. By observing the results of past campaigns, it should be possible to at least land in the right ballpark.
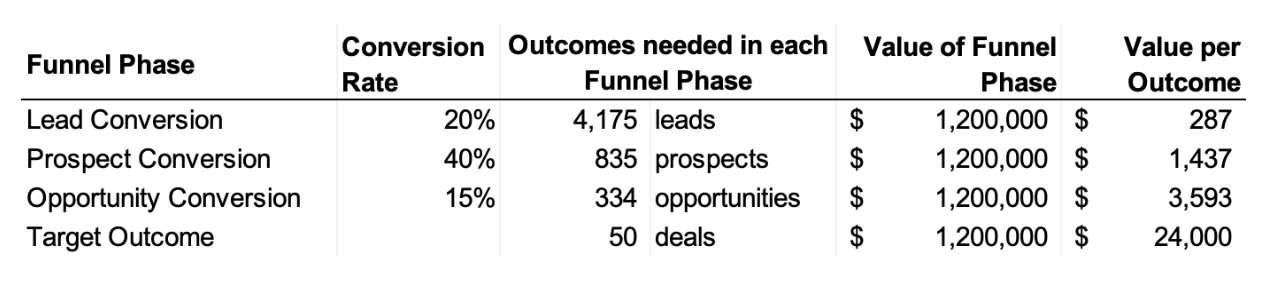
You may recall our third principle of MROI earlier, that every phase of the funnel has the same value as the target outcome. Based on this, we can ascribe a value to every funnel outcome by dividing the funnel value by the number of outcomes required at each phase in the funnel.
Finally, we need to decide how much of our marketing budget we’re going to invest into each phase of the funnel. This is something that frequently does not occur as it should. It’s a common mistake to treat each phase in the funnel as its own discrete entity rather than as part of the larger engine which culminates in a target financial outcome.
The team will rely on its sales force to do most of the conversion from Opportunity to Deal. So it will only invest 2% of its budget into the last phase. It also knows from experience that it is relatively low cost to nurture leads through the middle of the funnel, so it dedicates 11% to convert prospects to opportunities, and 12% to convert leads to prospects. That leaves the remaining 75% for getting the leads into the top of the funnel.
Here’s what the funnel phases look like with this distribution of campaign budget:
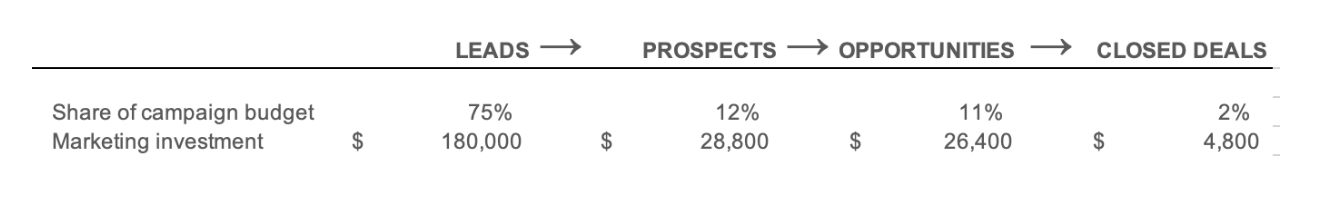
Note that the total marketing budget sums up to our target $240,000 budget to achieve $1,200,000 of target financial benefit at a 4x ROI.
As the campaign is executed, we can calculate the ROI of each phase cumulatively through the funnel, as follows:
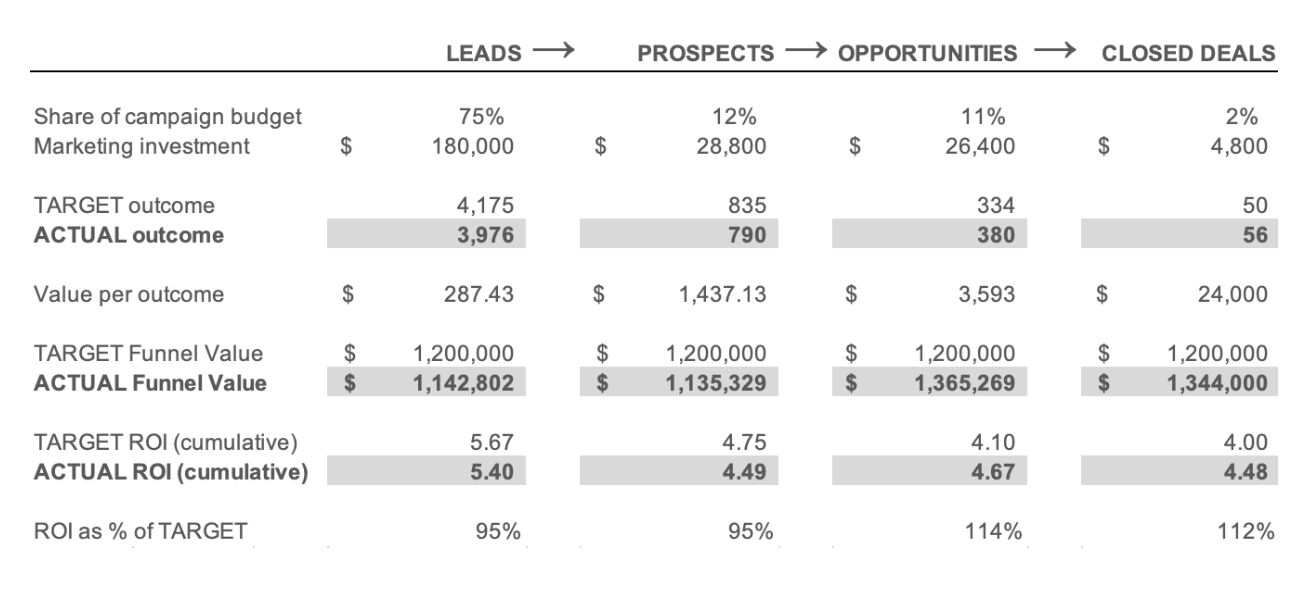
To understand this table, let’s look at the leftmost section, called LEADS, which represents the first phase of the campaign.
You can see that 75% of the budget has been allocated to this phase, which represents $180,000 of the available budget for the campaign. The target outcome is 4,175 leads. Because the value of the funnel is constant, you can calculate a value per lead of $287.43.
Unfortunately, when we look at the actual outcome of this phase of the campaign (in bold), we can see that we fell short, and only generated 3,976 leads. If we multiply out our value/outcome, that shows a funnel value of $1.14M rather than our target of $1.20M.
Because we’re dealing in real numbers, we can also calculate a target and actual ROI value for this phase of the campaign. Here, we have achieved an ROI of 5.4 vs our target ROI of 5.67 for this phase. Why does the ROI change as we proceed through the funnel? Because while the value of the funnel remains constant at $1.2M, our investment changes at each stage as we consume more of the budget. So the target ROI for top-of-the-funnel phases will always be higher than the ROI for late-stage phases. It may seem counterintuitive, at first blush, but it has to be the case if you follow a campaign ROI all the way through the funnel to a target financial outcome.
Although the campaign got off to a shaky start, you can see that you actually leave the 3rd phase of the funnel ahead of plan, and the team is able to close more deals than originally targeted, meaning that the overall campaign exceeds the target ROI—you aimed for an ROI of 4.0 and achieved an ROI of 4.48, 112% of target. Here’s a visualization of how the program evolved through the phases:
The actual ROI (yellow line) started off short of the target, but ended up overtaking the target and beating expectations. The next time a similar campaign is to be run, the marketing team should assess whether they had their assumptions about conversion metrics at different stages of the funnel wrong, or whether this was just natural variance that can’t be controlled for.
The next chart, below, shows how the campaign performed as a percentage of target ROI at each stage in the funnel. This allows the team to understand whether they have performance issues they need to address, and to ask themselves whether they staffed and sourced the campaign optimally.
Finally, we can see the evolution of the funnel value (the number of outcomes multiplied by the value per outcome). This shows that our funnel value ended up ahead of our target financial outcome, and this is what drove our ROI to be even better than the targeted ROI of 4. Note that the target financial outcome remains constant throughout the campaign. That is one of the principles of calculating the true ROI of the campaign.
The approach above applies to any marketing campaign—churn reduction, account-based marketing, cross-sell and upsell, and so on. It also allows you to zoom out your ROI perspective and to pull together various marketing activities that cohere into a target financial outcome.
For example, it may not seem like a positioning program and a meeting generation program are part of the same effort initially, but they actually are different phases of the same overarching campaign to reach a financial target. As such, the entire ROI for that marketing funnel should be measured as a whole, both on a return and an investment level.
Baseline and Benchmark your Performance
It is important to understand how your campaigns are performing in absolute terms, meaning that you have an understanding of whether a given campaign is contributing what is needed to meet your defined targets.
It is also critical to measure relative performance over time. Is the team as a whole improving, holding steady, or declining, from an MROI perspective? Are there certain individuals whose campaigns overperform consistently? By maintaining a consistent approach to MROI across campaigns and over time, you can more effectively assess and communicate these measures.
There are several reasons it is worth taking a consistent approach to measuring MROI using the approach outlined above, including:
- You can place all marketing campaigns into the context of financial outcomes. If you find that you can’t do that – if there is no path from a marketing activity to a financial outcome – then you should question whether that marketing activity is a priority.
- You can communicate to your team and to the broader organization when and how different types of marketing will yield a benefit, and be able to frame how something that may seem difficult to quantify (e.g. downloads of a thought leadership piece) is actually an event that carries a specific monetary value.
- You can measure the performance of individuals in your team based on a constant funnel value. Even if the overall campaign is not successful, you will be able to see who was able to deliver on their phase of the campaign and who was not.
- You can organize what may initially seem like disparate marketing activities into coherent campaigns that culminate in a specific target financial outcome.
- You can better justify your marketing budget, and better justify your requests for greater investment.
- You can make quicker, better decisions on which marketing activities to adjust, or curtail, based on the ROI forecast against the target funnel value.
- You can seek out benchmark data to see how your results compare to companies like you – that’s where Planful comes in.
Summary
In this blog series, we’ve talked through the importance of being mindful about what you measure.
We identified that the best, simplest marketing metrics are found in a relatively small set of variables.
We emphasized that to measure first-order ROI, we must ground our marketing activities in specific financial targets. These are well understood by everyone, including non-marketers, and they communicate true business value. You may have to zoom out your perspective to see how best to connect marketing activities into coherent campaigns that reflect a true marketing funnel.
You should ensure that everyone in your organization fully understands that marketing campaigns do not – and should not – conform to the boundaries of a fiscal year: marketing campaigns from last year will help you this year; campaigns from this year will help next year.
You should adopt a consistent approach to MROI over all your campaigns, and measure performance in each phase of the funnel, and relative performance over time.
If possible, you should compare your MROI results to industry peers.
——————————————————————————————————————————————————————-
Dan Faulkner is the CTO of Planful, the first AI-Driven marketing planning software. Dan has degrees in speech and language processing and marketing. He got his marketing degree after running research for text-to-speech synthesis research at SpeechWorks (now Nuance) and must have been looking for something easy to do. You can follow him on Twitter and LinkedIn.


Latest Posts
Blogs
Interviews, tips, guides, industry best practices, and news.
Get Started with Planful
- How much time will you save?
![LinkedIn]()
- How will your finance team evolve?
![LinkedIn]()
- Where will technology support you?
![LinkedIn]()
