How Much Should You Spend on Marketing? Everything to Know


Determining how much a company should spend on marketing is a common question that CMOs and marketing professionals face, and yet, the answer can be complex. There are so many questions that marketers have when it comes to figuring out how much to spend on marketing.
When determining how much to spend on marketing, here are some common questions include:
- What is the average marketing budget for a company of my size?
- Is there an average percentage of revenue that should be spent on marketing?
- How much do other companies spend on marketing in my industry?
In this post, we determine how much companies should spend on marketing and the benchmark factors that really matter for this answer, which ultimately can create variability in the answer.
Benchmarks and Marketing Spend
How much of your budget should your company spend on marketing? Should it be a percentage of revenue? When it comes to marketing budget management, there is no single, easy answer. With this guide, you can quickly arrive at a range of marketing budgets.
Benchmarks are only one part of the story
There are some great resources available that provide marketing spending benchmarks. When I was the CMO of a large public company, marketing leaders from our divisions would often come to me and say, “We should be spending more in marketing in our division. It says so in the CMO benchmark survey!” The problem with using benchmarks to determine marketing spend is that they are an average of a broad range of data from a highly variable set of companies. In addition, the data is often self-reported.
The data reporting can also be inconsistent based on the specificity of the survey instrument. For example, are product managers part of marketing or development? Is the entire CRM cost part of the marketing tech stack, or are the sales licenses charged to the cost of sales? Are your business development reps used for lead qualification part of sales or marketing? Is employee communications part of marketing? You get the point: there are many ways to define what is inside your total cost of marketing.
Regardless of their issues, benchmarks can be an important piece of the puzzle you need to assemble to define the right level of marketing investment for your company and determine how much to spend on marketing.
Top-down vs. bottom-up budgeting: which approach should be used?
When it comes to top-down vs. bottom-up budgeting, which approach makes sense for your marketing budget? The answer is “Yes.” You should take both a top-down and bottom-up view of the marketing budget in your process. I recommend that you start with the top-down approach first to make sure that you understand the high-level constraints you are dealing with. In many companies, the budget is defined by the CEO or CFO. If you do your homework, you should be able to set the context for managing your marketing budget before it is handed down to you.
Once you have framed out a high-level spending range, it is critical to map your campaign plans and expected results to the objectives you are being asked to sign up for.
Factors that will drive differences from the benchmark data
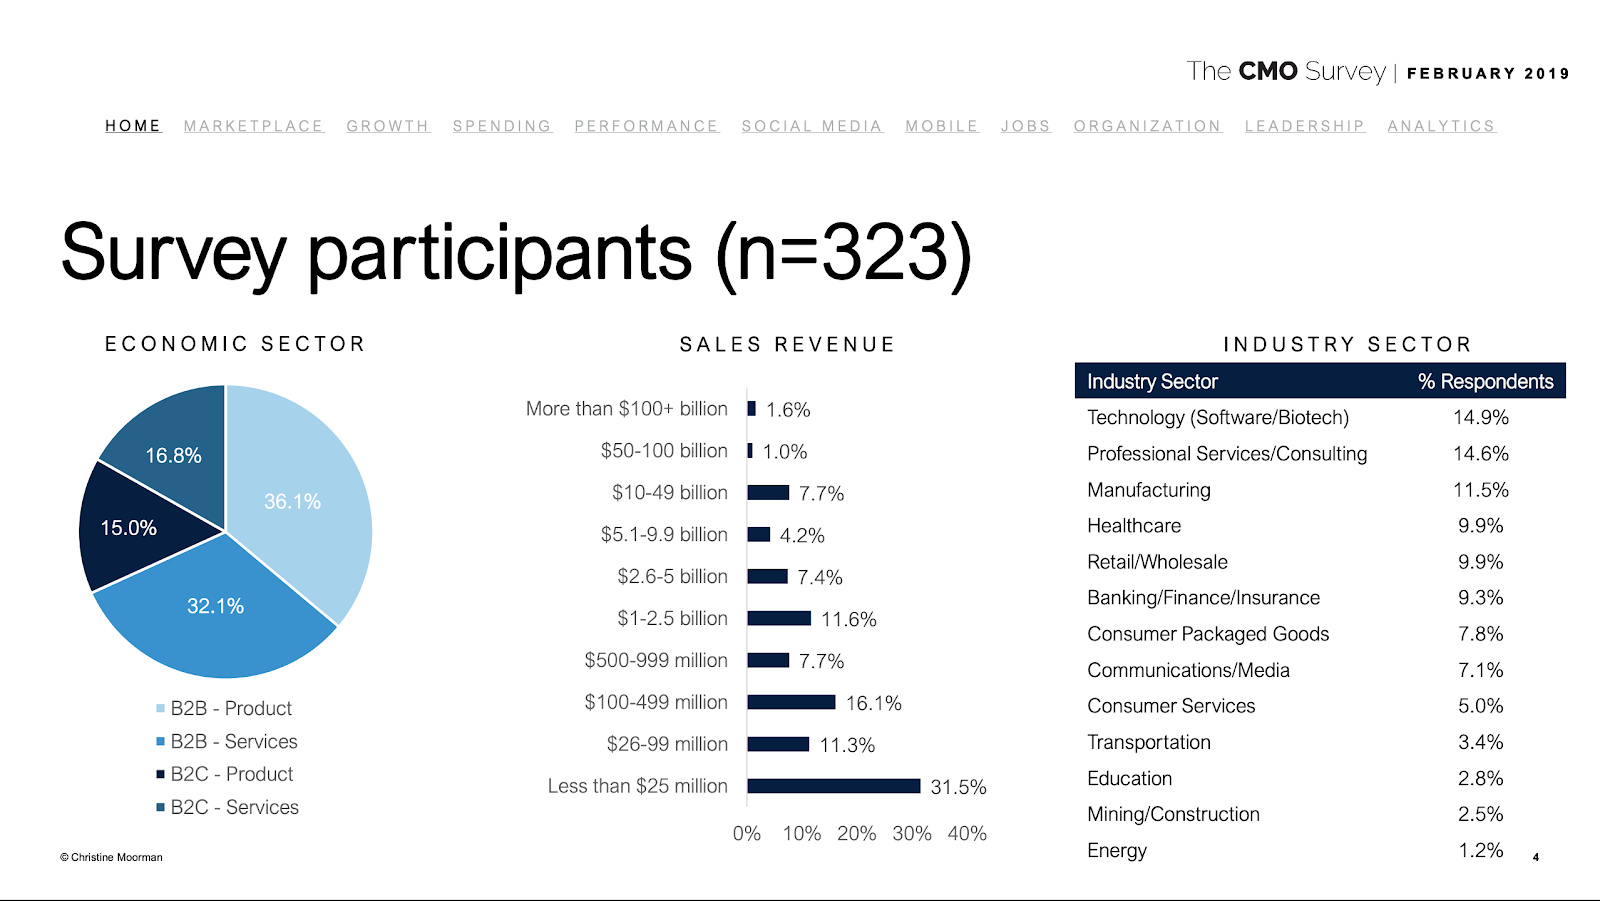
Ideally, when determining how much to spend on marketing, you should start with a benchmark report with a segment that can be closely mapped to your company. The CMO Survey from Christine Moorman of Duke University is an incredibly valuable research study. The survey participants provide exhaustive data that is quite useful for overall insights and trends, but with 323 participants in the survey, you can see how you can resolve down to very small segments.
The report breaks down the participants by economic sector (B2B vs. B2C and product vs. services), annual revenue, and industry sector (vertical). If you have revenue between $26-$100 million, for example, you are one of 36 companies. But that segment might include a retailer and school – two very different marketing profiles.
The point is that even the best reports (like this one from Christine Moorman) are only part of the answer when establishing a marketing budget.
Factors
Let’s explore the factors that might drive a variance from benchmark data when deciding on marketing budgets.
- B2B vs BC2
- Product vs Services
- Industries
- Marketing Strategy
- Buying Metrics
- Insource vs Outsource
- What’s Inside Marketing?
B2B vs. B2C (vs. B2B2C). Marketing investment levels, strategies, and tactics vary greatly based on the target buyers and go-to-market model.
Product vs. services. The CMO Survey breaks out products vs. services, which can provide some interesting insights. Services typically have a relatively low gross margin because of the labor cost to deliver services. They also have a different level of scalability because of the potential labor scarcity. Of course, there are many examples of high-margin services (expensive consultants) and scalable service models (like Uber), but it provides a potentially useful lens.
Industry vertical. When it comes to marketing spend by industry, the industry sector can be interesting, but you still see a great deal of variability in the marketing budget inside each sector.
Marketing strategy. The marketing strategy employed is a major variable and often overlooked. For example, if you have a targeted account approach (or ABM) vs. a digital demand generation strategy or content marketing strategy, you will see a lot of variation in spending.
Buying metrics. The type of buying cycle and related metrics can be quite useful. For example, do you have a highly considered, expensive offer with a long sales cycle or a candy rack item sold in e-commerce stores?
Insource vs. outsource. A key decision based on your marketing strategy and your available resources is the level of outsourcing you use for your marketing. If you have a heavy content-based strategy, you may need to consider hiring a staff of content strategists and creators, or you may decide to outsource. In most cases, insourcing makes sense if you have a well-established strategy, but it may change the way you think about your marketing budget.
What’s inside marketing? Not every marketing team includes the same stuff. For example, you may include product managers inside the marketing team while others will include them inside the R&D line. Marketing may be responsible for some of the sales technology stack, like the CRM system, while others include those investments in sales.
Approaching The Answer Through Financial Metrics
Benchmarks alone can’t answer how much a company should spend on marketing. In addition to benchmarking, you need to consider the financial metrics specific to your business. This should not just be the average percentage of revenue spent on marketing by industry.
To determine the marketing budget and how much to spend, here are the metrics to look at for your company specifically:
- Gross Margin
- CAC Targets
- Payback Time
- Customer LTV
- Growth Rate
- Profitability Targets
- The Rest of the P&L
Gross margin
Marketers are often tempted to view marketing spend as a percentage of revenue as the denominator for their spend ratios, but that is only part of the story. You need to understand how much of the pie needs to be reserved for delivering the product or service before you start dividing up the rest.
If your company is a SaaS company, you likely have margins over 90%, but if you have a services business, a physical product, an affiliate model, or other product costs, you may have a much smaller percentage of revenue left over to fund business operations.
CAC targets
Many companies (especially SaaS companies) understand their targets for the costs of acquiring a customer. This can provide an important limit to the amount spent on sales and marketing to create new customers. For a detailed description of CAC, see this great article from Dave Kellogg: What Marketing Costs Should be Included in CAC Calculations?
Payback time
Related to your CAC targets, you need to understand how long it will take to pay back the customer acquisition costs. For example, if you have a subscription business that charges $500 per month and a customer acquisition cost of $5,000, it will take about 11 months to recoup the costs if you have a 90% gross margin.
Customer LTV
Another important measure is the lifetime value of a customer. The LTV is a key determining factor of the CAC target. For example, if you have a subscription service that costs $10,000 per year for a typical customer and your churn rate is 10%, your lifetime value should be $100,000.
Growth rate
If your company is growing 50% year-over-year, it often makes sense to invest more to accelerate the growth. But if your revenues are flat, you will not be able to spend as much on marketing. Profitability is much more important for companies with flat growth, and your percentage of revenue spent on marketing goes down.
Profitability targets
Understanding your profitability targets will help you understand the practical range for marketing investments. In high-growth SaaS companies, you should consider the Rule of 40. In short, your net income and growth rate should be at least 40%.
For example, if you grow at 60%, you can tolerate a 20% loss. If you are growing at 10%, you should have a 30% net income. See this article from Dave Kellogg for more on the Rule of 40: The SaaS Rule of 40
The rest of the P&L
Finally, you need to understand the rest of the P&L for the business to make a recommendation. If you invest heavily in product development, you may have to live with a lower investment in marketing to deliver on your profitability targets.
Related: How to Optimize Your Marketing Spend
Putting It All Together: How Much To Spend on Marketing
So, we come back to the question, “how much should you spend on marketing”? With all of that background on marketing budgets, it is time to develop recommendations. Here is a breakdown of the steps to get there:
- Defining the maximum operating range. Using the financial benchmarks above, you must start with an upper bound for your marketing spending. You may have several ways to get to the answer – if you do, plot all of them. Knowing the proposed P&L for all functions and the profit target will provide one data point. If you are a SaaS company and don’t have a profitability target, then back into the number with the Rule of 40. These numbers will provide a sense of the ceiling for your marketing budget.
- Identify any relevant benchmarks. Next, to determine your marketing budget, look for existing benchmark data from one or more sources in the article above and plot them on the chart.
- Itemize unique financial differences in your company. Now list the unique characteristics of your company that would have a positive or negative influence on the number. For example, if you have a high growth rate, that would justify higher than normal spending. If you have low margins, that would imply a lower level of investment.
- Estimate an operating range. Finally, you need to make an editorial call. With the data in front of you, use your best judgment to define a budget range for marketing for your company.
Check against the bottoms-up plan
You to deliver on your marketing targets.
Does the marketing investment line up with the results you would achieve given the historical performance of marketing at your company? If it assumes an increase in performance (cost per lead, visibility, product launches, etc.), what is expected to change to deliver improved performance?
The details of the bottoms-up plan will be the subject of a future post. Stay tuned!
Planful is a leading marketing planning software for CMOs and marketers to build detailed plans to accomplish key goals.


Latest Posts
Blogs
Interviews, tips, guides, industry best practices, and news.
Get Started with Planful
- How much time will you save?
![LinkedIn]()
- How will your finance team evolve?
![LinkedIn]()
- Where will technology support you?
![LinkedIn]()
