Budget Burn Rate as an Indicator of Marketing Execution Risk


We know that responsible marketing teams should not overspend. It causes P&L issues, can disrupt the marketing cadence if campaigns have to be canceled because the budget has been exhausted, and leads to general disharmony. Something less well covered but equally important is marketing underspend. This blog introduces how budget burn rate is an indicator of marketing execution risk.
One of our favorite customers at Planful came to us because their finance team had told them that they were underspending chronically throughout the fiscal year. The problem was opaque to them because of their existing tools and processes: the typical combination of spreadsheet-based marketing budget and episodic accounting system dumps from finance. It was impossible to have real-time visibility into what they had spent and what was left in the budget for that time period.
As they moved through the year, they didn’t know whether they could make that next significant purchase, or whether that would take them over budget, so they did what most responsible corporate citizens did: nothing. Better to be under-budget and safe than potentially over-budget, right? And they could always roll forward any unspent budget into the next time period and spend it then.
Unfortunately, this is not the right way to manage marketing budget. You can’t endlessly roll forward unspent funds because the end of the fiscal year (or fiscal quarter) is a brick wall. At some point, you find yourself upon the wall, and the unspent funds piled up against it are swept into the corporate coffers having added no value to the business.
That might mean the company saves a little money, but it also means the marketing team has demonstrated that it does not have the wherewithal to spend the budget it was allocated. Worse, they have not delivered the business benefits of the marketing investments they failed to make. This can raise questions about whether marketing is operationally sound. Since actual spending typically sets the baseline for the next year’s budget, underspend can lead to year-over-year reductions in marketing budget.
The Underspend Conundrum
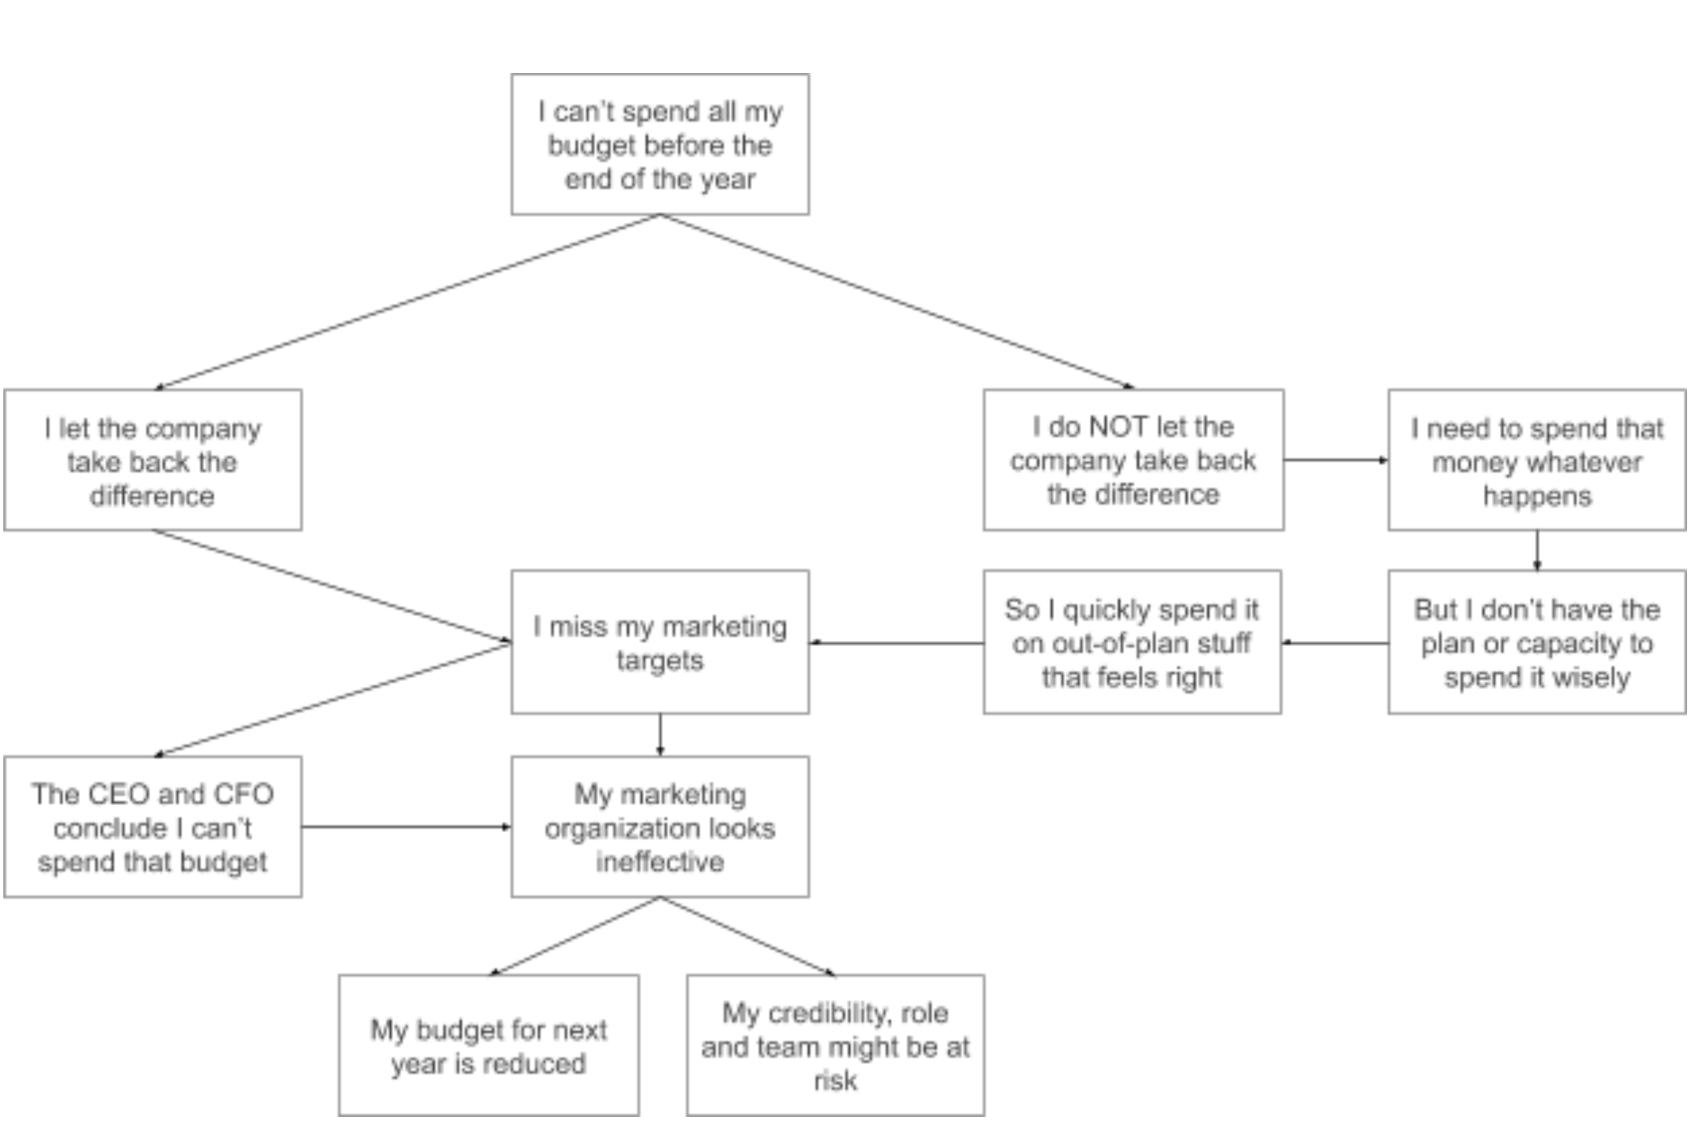
Figure 1. The underspend conundrum
It is probably worth bringing to the fore a critical, but implicit point: marketing needs to spend 100% of its budget, spend it promptly, and spend it thoughtfully. If this seems obvious, it isn’t to the many marketers – and corporate cultures – who think it is a virtue to come in under budget. It is not. It’s a virtue to spend less on electricity than you intended or to implement a corporate IT project under budget. But marketing underspend fails the business and can lead to unwanted consequences, as illustrated above.
If marketing underspends, then it breaks its compact with the company about what it is going to deliver in terms of pipeline, leads, brand enhancements, awareness, and so on. In an ideal world, a marketing team spends every penny of its budget aligned with marketing goals and against a well-structured plan.
With the existing systems in place for managing marketing budgets at most companies, this is impossible. Note that I did not say it’s nearly impossible: it’s impossible in every practical sense. Most marketers discover somewhere between 6 and 8 weeks after the fact what they have spent. This time lag necessarily crosses monthly budget boundaries, and frequently runs into harder quarterly budget boundaries. If you don’t have visibility into what budget is available right now, and you know that heads will roll if you overspend, it is human nature to slow down in moments of uncertainty. If those moments of uncertainty are frequent enough, you will have the same kind of chronic underspend that our customer was experiencing.
The first step is to do what they did, and move your plan and budget onto software that provides real-time visibility into planned, committed, and invoices expenditures. You don’t have to wait for the final payments to be made by finance, and then to receive the AP or open PO report to have that current visibility. You just need a system to track it. You can always interlock to the penny with the finance system once their reports land in your inbox but there is no need to fly blind in the meantime.
Another key step you can take is to get familiar with the concept of Budget Burn Rate.
Introducing Budget Burn Rate (BBR)
Before we introduce the concept of BBR, we are going to make and test a key assertion: that when a marketing leader finalizes their marketing plan and budget, they will have in place a staffing and resource capacity – or at least a capacity plan – to execute the plan and spend the budget within the fiscal year. Are there enough FTEs, contractors, consultants, agencies, tools, etc., in place to actually deliver the plan on paper? Our assertion is that for the majority of the time, the CMO has verified this, and believes that their plan and budget is efficiently executable with the resources on hand.
This is a critically important assumption to the concept of BBR, so it’s worth a moment to test the logic. Do we think that it is more likely or less likely that marketing leaders enter a year in the following states?
- The CMO has no idea whether or not they have the capacity to execute their plan and budget
- The CMO is knowingly overstaffed and could execute a much larger plan and budget than the one they have
- The CMO is knowingly under-staffed and knows they cannot execute the plan and budget than the one they have
We believe that for the large majority of marketing organizations the answer to all three questions is “less likely.” In other words, most CMO’s have some degree of interlock between their marketing budget and their capacity to spend that budget in a thoughtful way. We only care about this assertion in the abstract for now. While it’s true that a small team doing nothing but digital campaigns can burn through a huge budget quickly compared to a team that does nothing but field marketing and regional events, we believe that the capacity of a marketing team (not just FTEs, but all contract labor, agencies, as well) is normally at least roughly right-sized to the nature of the marketing plan, its required campaigns and tactics, and the size of the budget to support it. If you’re with us, read on.
What is BBR?
BBR is a function of change, like miles per hour, GDP per capita, calories per slice of pizza. In the case of BBR, we are measuring how much budget needs to be spent per time period for the remainder of the year in order to consume 100% of the budget accurately and thoughtfully (where thoughtfully means in alignment with the marketing plan). We’ve picked a day as the unit of time. It could be a week or a month, but the bigger the time unit, the less granularity we have.
Imagine you have a budget of $1,800,000 for a fiscal year. Regardless of how you intend to allocate marketing budget over time and by campaign, you need to consume that budget in the next 365 days. On day 1 of your fiscal year, your required average BBR is $1,800,000/365 = $4,932/day.
Now let’s assume that you decide to allocate your budget across the months like this:

It doesn’t matter that the allocations by month are different to each other, nor that the most expensive months require the team to consume 190% of the least expense month’s budget. We assume that there is a marketing capacity in place that is right-sized to consume this budget at this rate over the course of the entire year.
After January, there are 334 days left, and if the entire $100K that was budgeted for January has been spent, the required BBR for the remainder of the year is now ($1,800,000 – $100,000)/334 = $5,090/day. If the budget is spent perfectly, here’s what the curve for the daily BBR looks like over the course of the year:
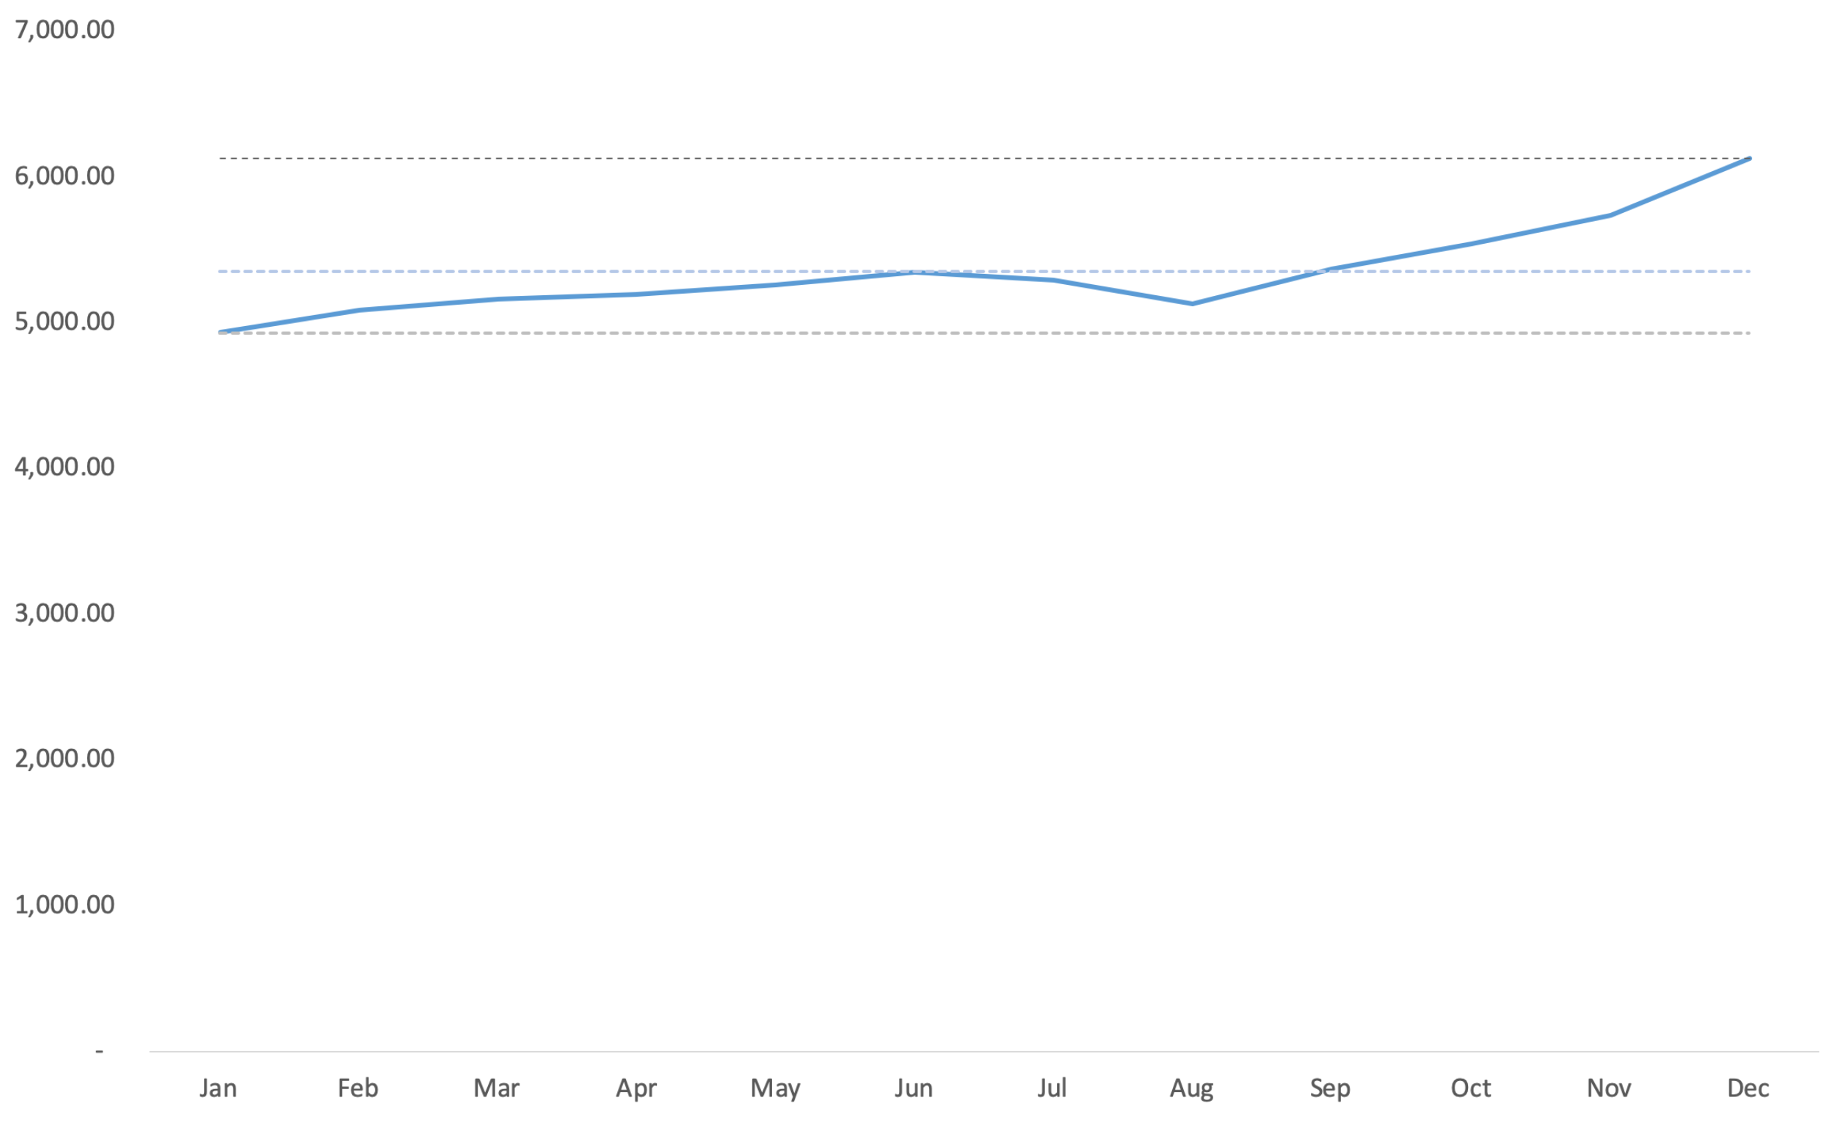
Figure 2. Planned BBR with Min, Mean and Max lines
The dashed lines indicate the minimum daily burn rate, the mean daily burn rate, and the maximum daily burn rate required to consume the budget on-time, with a range of $4,932 – $6,129/day. As long as the burn rate stays within those bounds, the capacity of the team should be well sized to execute the marketing plan and fully consume the budget on time.
Now, let’s say that as the year gets underway, the team consistently spends a little less than planned each month. For this example, we also assume that any underspend is continuously rolled forward month-to-month.
Traditionally, this kind of delta would normally be portrayed using something like the chart below. In this chart, the blue line indicates the original plan, the red line indicates the cumulative actuals and the green line indicates the cumulative underspend. It doesn’t look that bad. At first blush, it looks like the team tracked along roughly accurately but finished the overall plan fairly close to the original. In reality, this is a 10.5% underspend – that’s a large discrepancy from the original plan. That most likely means that there are significant shortfalls in pipeline, bookings, leads, impressions, and so on that the business now needs to cope with.
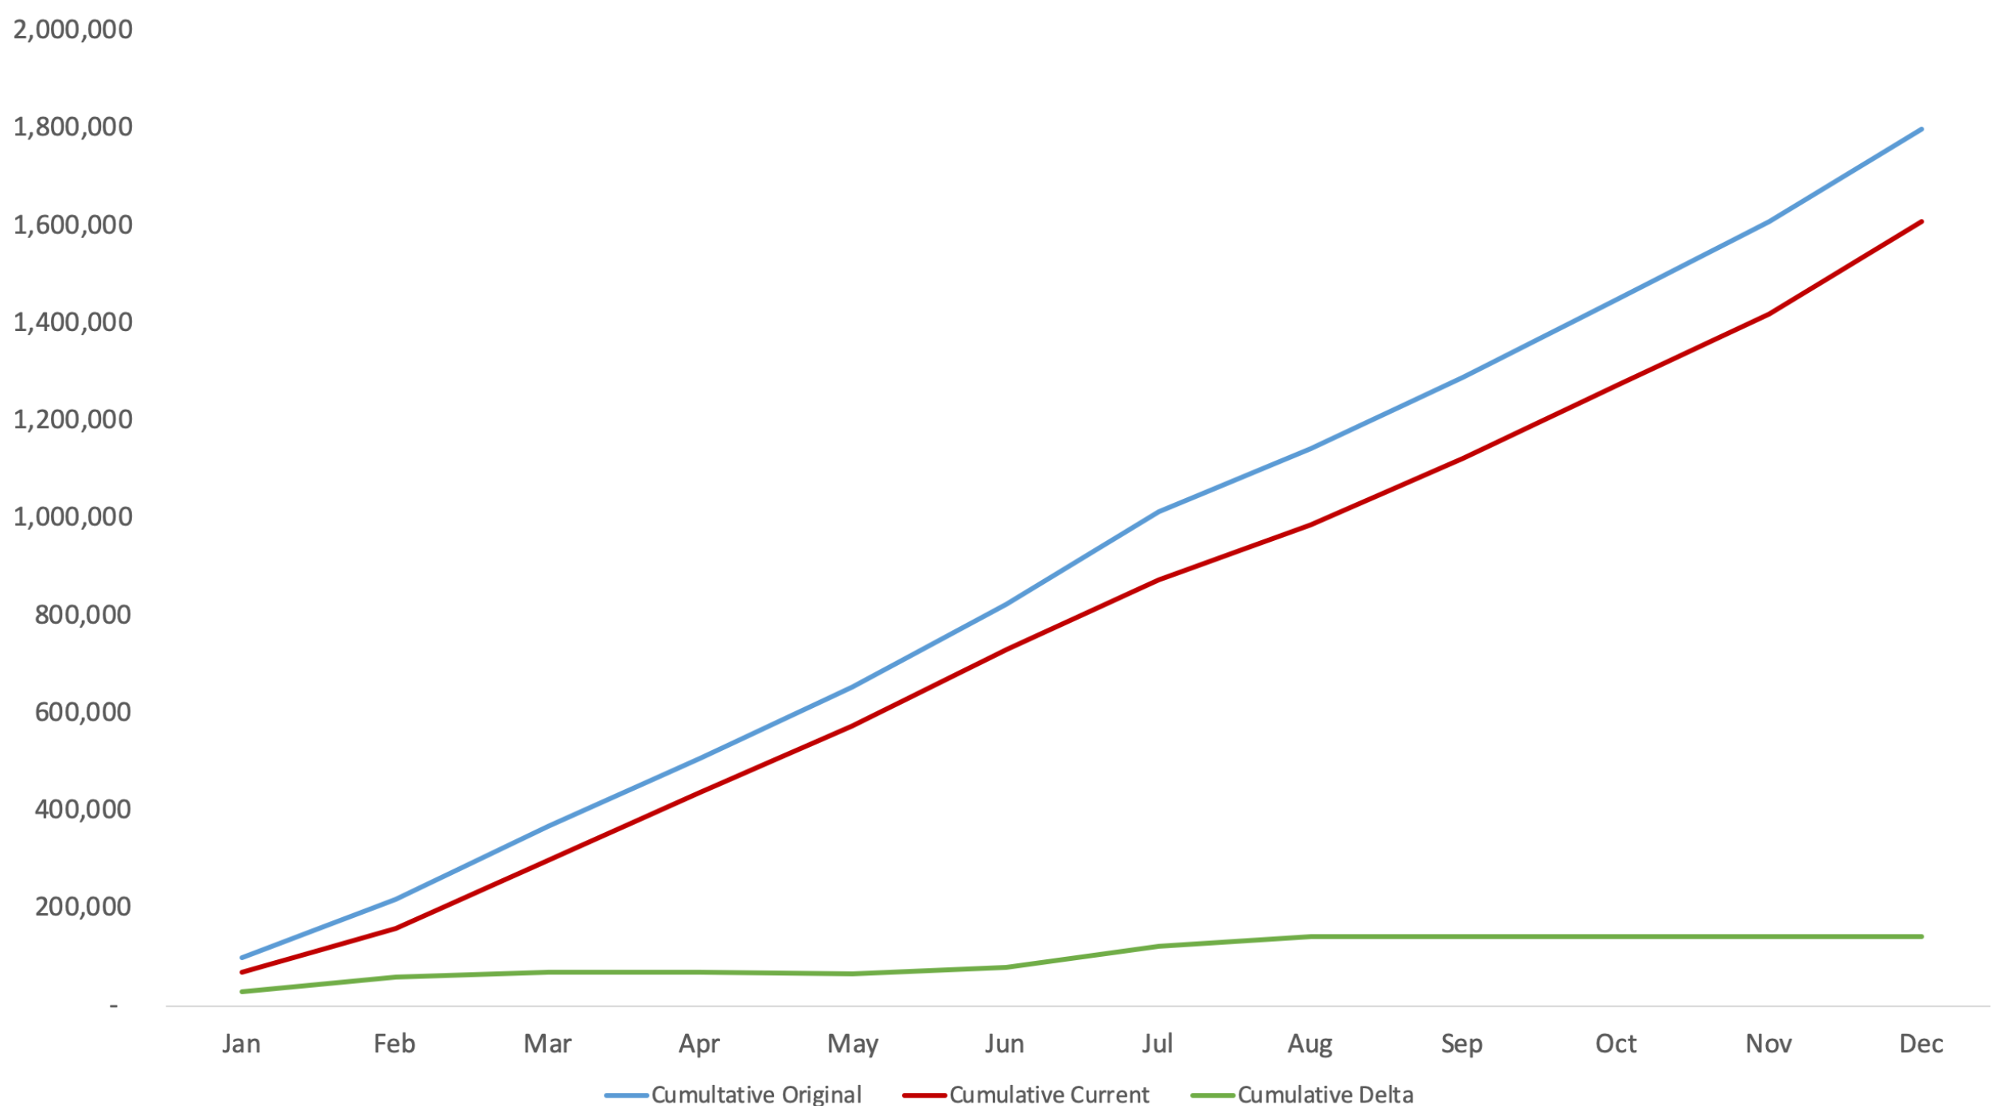
Figure 3. Typical comparison of Planned vs Actual budget usage
This is also not a particularly helpful view analytically because it isn’t actionable. If we cast this same data onto a BBR view, however, we see something more alarming, more realistic, and more actionable:
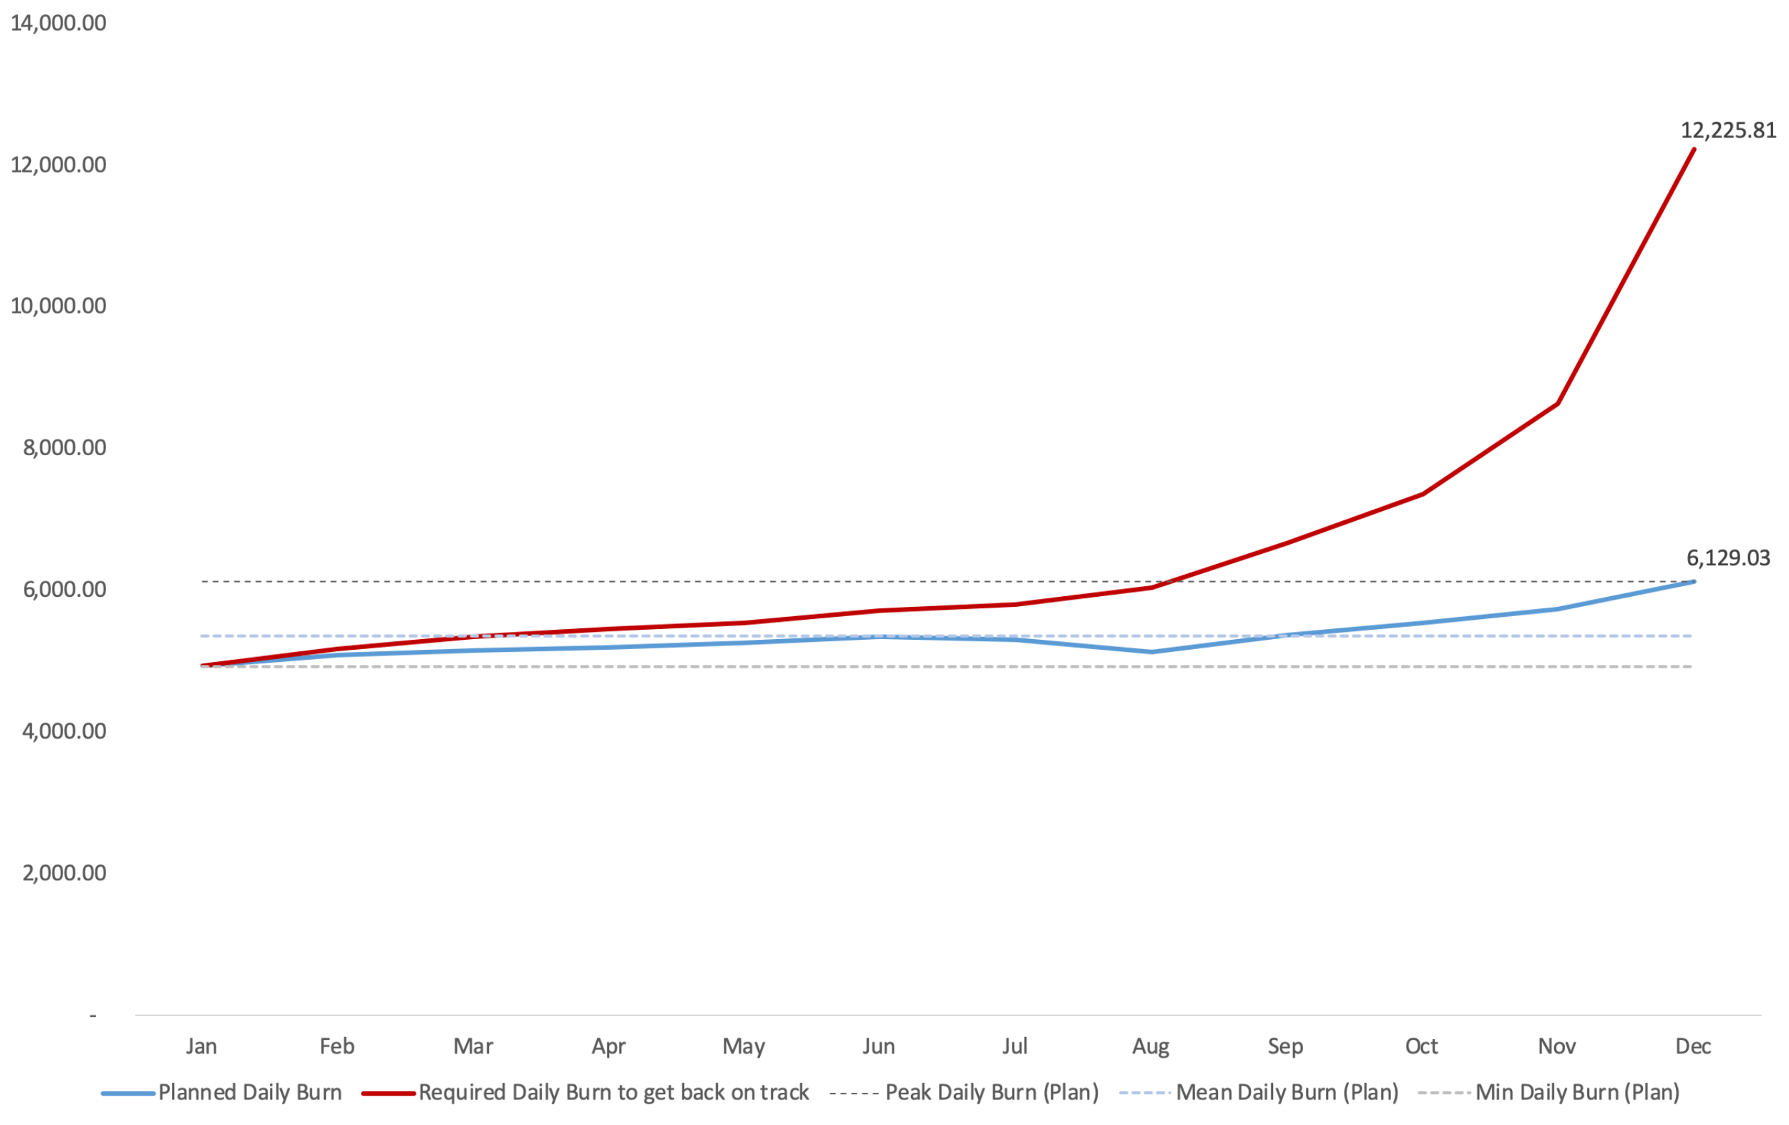
Figure 4. BBR representation of Planned vs Actual, indicating growing execution risk over time
As the underspend accumulates over the year, we can see the required daily BBR (the red line) begins to increase and separate from the planned daily BBR (the blue line). In early August, the required Budget Burn Rate breaks through the maximum BBR for the year (remember, that approximates the maximum capacity of the team).
As the underspend piles up month to month, the required BBR accelerates away from the plan BBR. This is because the time available to spend the rolled forward budget is running out – the denominator is shrinking while the numerator is growing relative to the original plan. In plain English, there’s more money to spend than we thought there would be in a shrinking time frame. We’re about to hit the end-of-year wall.
Imagine you are the CMO running this budget and it’s November. You have a lot of money to spend. Your team is fully occupied executing as much of the plan as they can – but they’ve been consistently under-spending throughout the year. What are you going to do? You need to spend twice as much money as you normally spend through the rest of the year and your team is fully occupied. Look back again at the Underspend Conundrum flow chart above and you will see there are few good choices. Marketing teams find themselves in this position all the time.
Budget Burn Rate as a forecast of execution risk
Do we need to careen into the year-end wall, frantically trying to spend more money than we can – knowing we’re not spending it wisely? We believe Budget Burn Rate can help avoid these situations. As soon as we see the BBR begin to deviate above the plan BBR, we know we’re underspending.
As the gap begins to widen, the risk increases. Before it approaches our maximum team capacity we need to begin to increase our BBR so that we can pull the red line back into order to match the blue line. Perhaps we need to hire some more temp help or open the throttle on that digital campaign. The remediation is case-dependent but the value of bringing the current and plan BBR into alignment is clear – it means we can finish the year by spending our money intentionally, phased appropriately over time, and in accordance with our strategic goals. If we’d been measuring BBR, we would have seen this move of the red line towards our maximum capacity early in the year and been able to take action while we were still in the first half of the year.
In another post, I will return to Budget Burn Rate to discuss what happens with BBR when we have a chronic overspending problem. In the meantime, we’d love to hear your thoughts on BBR. Learn more about our marketing budget tracker as one of Planful’s many features.


Latest Posts
Blogs
Interviews, tips, guides, industry best practices, and news.
Get Started with Planful
- How much time will you save?
![LinkedIn]()
- How will your finance team evolve?
![LinkedIn]()
- Where will technology support you?
![LinkedIn]()
