


Empower Your Team to Drive Financial Success.
Unlock financial agility and take control of your company's financial performance with Planful.

Empower Your Team to Drive Financial Success.

Our Users Love Us


1,400+ Customers Trust Planful’s Financial Performance Management Platform
Discover the Planful Difference
Planful transforms the way you plan, close, and report so you can drive more impactful decisions across your business. Align every squad, inform every move, and change direction using a platform designed to improve your financial performance.
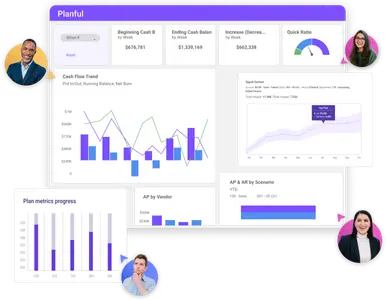
Planful for Finance
Eliminate the waste of manual time-consuming processes to provide better insights and have the confidence to guide the business faster than ever.


Speed, insights, and confidence to guide business growth.
Plan, Budget, and ForecastAlign your strategic business objectives with financial planning, budgeting, and forecasting processes.
Scenario AnalysisExplore every option while remaining ready to pivot at any moment.
Rolling ForecastsPlan often and accurately to keep up with business changes.


Your One-Stop Shop for Financial Performance Management Software
Learn why customers love us


Rated 4.3 out of 5 on 379 reviews on G2
Fast Time to Value With an Interface Anyone Can Adopt
Purpose-built with financial intelligence, the Planful Financial Performance Platform requires minimal IT effort, caters to all users and teams, and truly allows financial processes to be a team sport. Realize, in mere weeks, how unrivaled forecasting accuracy from native AI-driven, real-time collaboration, and an effortless user experience can liberate you to focus on results.
Not Loaded
Take the Pain Out of Growing With an Endless Runway of Scalability
Scale with ease and without compromising performance. Accelerate growth by satisfying increasing demands for data with trusted, role-based security and controls that give every team the tools they need to manage mega-complex and challenging processes. Recognize opportunities, evaluate every scenario, and confidently course-correct using informed decisions that skyrocket success.
Not Loaded


Hear How Planful’s Financial Performance Management Software Works for Our Biggest Fans
Customer StoriesHere To Help Your Team Reach Peak Financial Performance
Along every step of the way, you’ll get unparalleled customer support, experienced guidance, and an ecosystem of domain experts as part of our commitment to driving prosperity for our customers, your employees, and the communities you impact. Because when businesses run better, they create a better society.
Learn more


You’re in Good Company


PS Logistics Trims Monthly Close by 80% and Finds $2.4 Million in Cost Savings with Planful Read the story
80% Faster
Monthly close time$2.4 Million
Annual savings with Planful

Cohort PLC Uses Planful to Take Finance and Reporting to the Next Level Read the story
6 Subsidiaries
Collaborate across 1 solution1 Week
In time savings per month


Dive Deeper Into Peak Financial Performance

Events and Webinars
Join us for online (and in-person!) events, conferences, and webinars worldwide.
View events

Planful Online Help
Continue your learning through professional training and instructional support, only one click away.
Learn more
Resource Center
Learn about the Planful’s advanced financial performance management platform, explore expert insights, and browse popular topics.
View resources
Get Started with Planful
- How much time will you save?
![LinkedIn]()
- How will your finance team evolve?
![LinkedIn]()
- Where will technology support you?
![LinkedIn]()
